One thing you can be certain about is that your organization will have more software releases this year than last. If you are using Argo Rollouts you already have a powerful tool to respond to this demand. All of these releases, however, need to be verified before they can go into production, verification that usually gets done by already overworked people. Now add blue/green, canary, and progressive deployment strategies to mix and you have a formula for long days and late nights.
OpsMx can help. The new OpsMx Delivery Intelligence module is an add-on to open source Argo Rollouts that automates and streamlines the release verification process. The organization sees faster, higher quality releases and you don’t get stuck verifying each one of them. Let’s take a closer look at how automated release verification works and how it might help. If you like what you learn here, you can see how to try it out for yourself at the end of this blog.
Challenges of Release Verification
When software releases for monolithic applications were less frequent, release verification was a manageable manual task. As applications move to microservices, each with its own release cadence and progressive deployment, new challenges have emerged:
- Release teams often have limited knowledge of the application. It is difficult to manually evaluate a new release without a clear picture of its expected behavior and operations.
- There is A LOT of data to sort through. Manual verification can sometimes be looking for a needle in a haystack as SREs sort through logs and metrics to identify which ones really matter.
- It’s difficult to determine deployment risks for distributed systems. While microservice based applications have multiple dependencies, Argo Rollouts is designed to work with only one service deployment at a time. To really understand the impact of a new release, you need to look at the release and all of its dependent services.
- There can be hundreds of releases every week (or day). Agile release processes, a focus on developer productivity, and microservices are radically increasing the volume of releases. Traditional methods of estimating risks using thresholds and static rules just don’t scale.
How OpsMx Delivery Intelligence Can Help
The OpsMx Delivery Intelligence module addresses these challenges by automatically validating new releases for you and recommending which ones are ready to go into production. OpsMx Delivery Intelligence starts from the assumption that the behavior of any new release should be largely consistent with the behavior of the prior release that is currently running. New releases are run for a specified period of time to collect data on their behavior, then this data is automatically compared to the baseline data from the current release. As this is an automated process, verification can be performed as often as desired, for example at every step of a progressive deployment.
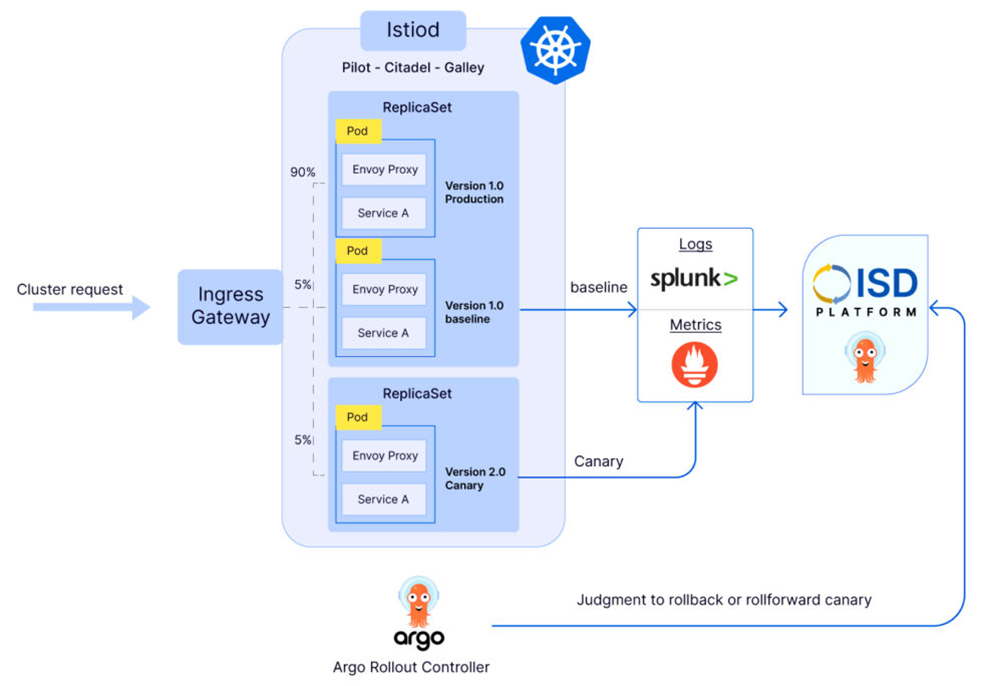
This diagram below illustrates how OpsMx Delivery Intelligence integrates with Argo Rollouts. In this example, traffic is split between a new canary release and the current baseline release using Ingress. OpsMx collects the logs and metrics of both the canary and baseline versions, including all the dependent services, from tools such as Splunk and Prometheus. OpsMx applies its AI/ML based analysis to the collected data to detect any anomaly in the performance and behavior of the new release and then generates a consolidated risk assessment report. If the release looks good the new deployment goes forward. If the release fails or if issues are detected then OpsMx correlates metrics outliers and log errors to identify the most probable cause, on which the developer and DevsOps teams can quickly take action.
Verification can be performed at the application or microservice level. For applications composed from microservices, OpsMx will aggregate the metrics and logs for all the dependent services to assess the impact of the release of a service on the overall application. As this process is automated, it becomes practical to verify thousands of microservices at scale before they are rolled into production.
What’s the Score? Evaluating a Release
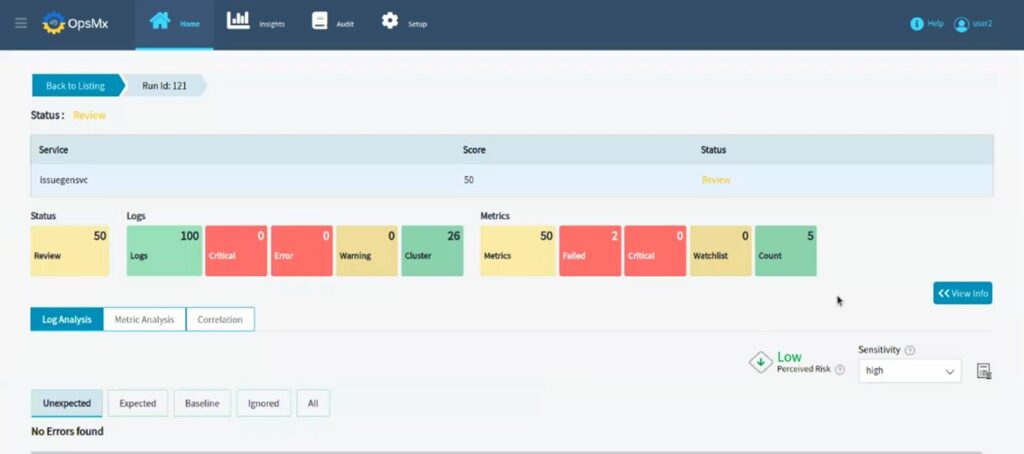
OpsMx summarizes the results of release verification as a set of easy to understand scores that you can use to guide the next steps in the release process. General scores give the “big picture” of a release, including:
- Log Score is based on Natural Language Processing (NLP) to categorize and classify the logs of a baseline release and a new release. OpsMx compares the two to assign a score to the new release based on the appearance of new or critical messages.
- Metrics Score evaluates key metrics like transaction time, memory consumption, and CPU utilization. If statistically these values are the same or better for the new release as the baseline release, the new release will score well. As a user, you can add or remove metrics from consideration, as well as change their relative weight in the scoring.
- Overall Release Score combines the Log and Metrics Scores to give a single picture of release quality. This is the score that is usually used to determine if a release should be promoted. A low score indicates that critical metrics in the new release are below expectations and/or critical errors may be present in the log output of the new release.
You’ll see these in the risk assessment summary in the Delivery Intelligence UI.
More specialized scores are also available, and you have the option of defining your own custom scores with metrics templates. Other standard scores include:
- Performance Score looks specifically at performance-related metrics, such as latency and throughput. This can be used to plan deployments for applications that have specific performance requirements.
- Quality Score looks at error rates, such as 400 errors and customer application errors, at the application, service, and API level. Quality scores can be used as feedback to developer teams.
- Reliability Score looks at obvious application failures as well as degradation of system resources, such as memory and disk access, during application operation. SREs can use the reliability score in their deployment planning.
While 100 is a perfect score, a release that scores 80 or more is generally “good” and can be promoted. A release that scores below 50 should generally be stopped or rolled back. Releases with scores of 50-80 are best reviewed by an SRE or developer to assess risks. You can set up a policy that will automatically triage releases based on their score to trigger roll forward, manual review, or rollback, minimizing how often people need to get involved in the process.
Start Now From Templates, Add Machine Learning and Integrations
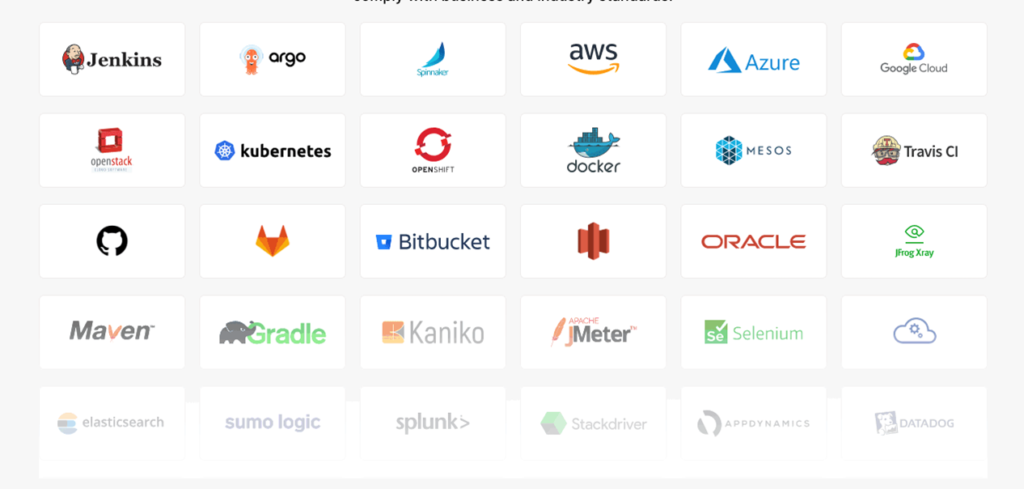
One of the big challenges in verification is knowing what you should be looking at. OpsMx Delivery Intelligence includes a base set of templates that can be used to get started along with integrations to 70+ DevOps tools. Using templates, an SRE can start using automated verification today with little or no knowledge of the specific application.
Metrics templates specify integration with common providers like DataDog or New Relic to gather the most commonly relevant data points for evaluating performance and reliability. OpsMx applies semi-supervised machine learning (ML) and statistical analysis to the collected metrics to model and identify regressions in performance of an application and its dependencies. Templates are specified in YAML, which makes them easy to customize. You can get started with what OpsMx provides, then expand the library over time based on the specific characteristics of your applications.
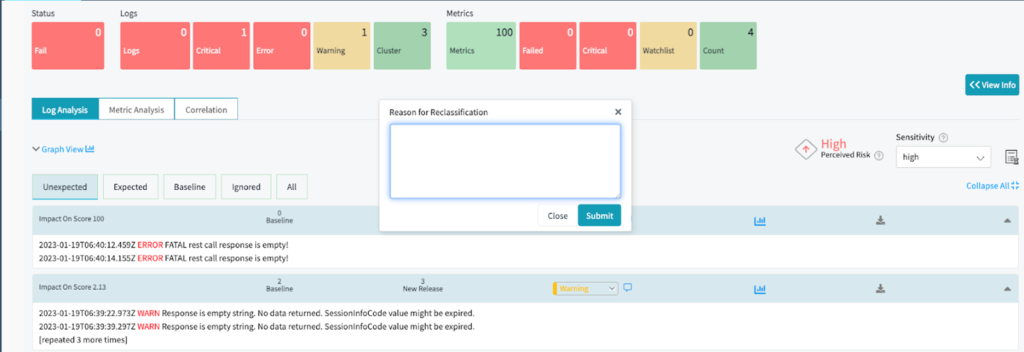
Log templates are used to pull data from Splunk, Amazon CloudWatch, or other tools. OpsMx applies NLP and unsupervised ML models to analyze log messages and cluster them based on contextual and text similarity. Unnecessary warnings and exceptions are automatically suppressed, making it possible to quickly identify anomalies and probable root cause of failures. Potential issues are called out for manual review. An SRE can use the results to file a bug report or change request, or can decide this is not in fact an issue, as shown below. OpsMx AI/ML models learn from this feedback and then exclude similar messages from future verification analysis.
OpsMx provides templates for integration with Istio, Ingress, and Prometheus for traffic shaping. Other supported monitoring data and log providers include Elasticsearch, Sumologic, Splunk, Stackdriver, Appdynamics, Datadog, Prometheus, New Relic, Graphite, Amazon Cloudwatch, Dynatrace, and Graylog.
Test Drive
It is easy to see for yourself how this works. The OpsMx Intelligent Software Delivery for Argo sandbox has a complete cloud-based deployment environment with Argo, Delivery Intelligence, and sample applications that you can deploy and validate. You can also try this in your own lab with your own applications – just contact OpsMx for a free trial. Or learn more by watching the recent webinar on this topic with OpsMx CTO Gopi Rebala. Then get ready to ship better software faster!
About OpsMx
Founded with the vision of “delivering software without human intervention,” OpsMx enables customers to transform and automate their software delivery processes. OpsMx builds on open-source Spinnaker and Argo with services and software that helps DevOps teams SHIP BETTER SOFTWARE FASTER.



0 Comments