Grafana is an open-source visualization tool used to monitor infrastructure in real-time. The visualization of data through graphs helps in log analysis and troubleshooting real-time infra issues.
Many companies are implementing Grafana as it can connect with many data sources, like Prometheus, MySQL, InfluxDB, AWS CloudWatch, and others. This flexibility of supporting various data sources and quick installation process has made Grafana quite popular among analysts, DevOps personnel, developers, and product managers.
How does Grafana achieve this interactive visual analytics?
It does so by the use of dashboards. Grafana dashboards are nothing but collections of various panels in the grid, which we can configure to show different functionalities. These dashboards could be in the form of graphs, histograms, charts, and geo maps, all of which serves the monitoring and data analysis part quite well.
However, Grafana is not limited to only the above features; we can also use the same for alerting. Grafana can be seamlessly set up with mediums like Slack, email, and Pagerduty, through which we can be notified if there is any breach of thresholds that we have set up in any of our panels in the dashboard, thus covering both monitoring and alerting.
Guide to setting up monitoring applications in a Kubernetes Cluster
We will now see how we can easily configure Grafana to monitor applications in a Kubernetes cluster in this blog. I will be using Prometheus as a data source here. The prerequisite is a Prometheus setup that will poll the metrics from your application, which will be used to configure Grafana dashboards after setting it up.
Usually, when you install Prometheus in your cluster, you should get a Grafana pod up and running by default. In case your Prometheus installation was devoid of Grafana. You can quickly use the below sample YAML to add Grafana to your Prometheus monitoring namespace.
1. Create a file, e.g. : grafana.yml, in your cluster
2. Copy and paste the below sample YAML in your above-created file
					apiVersion: v1
kind: PersistentVolumeClaim
metadata:
  name: grafana-pvc
spec:
  accessModes:
    - ReadWriteOnce
  resources:
    requests:
      storage: 1Gi
---
apiVersion: apps/v1
kind: Deployment
metadata:
  labels:
    app: grafana
  name: grafana
spec:
  selector:
    matchLabels:
      app: grafana
  template:
    metadata:
      labels:
        app: grafana
    spec:
      securityContext:
        fsGroup: 472
        supplementalGroups:
          - 0
      containers:
        - name: grafana
          image: grafana/grafana:8.4.4
          imagePullPolicy: IfNotPresent
          ports:
            - containerPort: 3000
              name: http-grafana
              protocol: TCP
          readinessProbe:
            failureThreshold: 3
            httpGet:
              path: /robots.txt
              port: 3000
              scheme: HTTP
            initialDelaySeconds: 10
            periodSeconds: 30
            successThreshold: 1
            timeoutSeconds: 2
          livenessProbe:
            failureThreshold: 3
            initialDelaySeconds: 30
            periodSeconds: 10
            successThreshold: 1
            tcpSocket:
              port: 3000
            timeoutSeconds: 1
          resources:
            requests:
              cpu: 250m
              memory: 1Gi
          volumeMounts:
            - mountPath: /var/lib/grafana
              name: grafana-pv
      volumes:
        - name: grafana-pv
          persistentVolumeClaim:
            claimName: grafana-pvc
---
apiVersion: v1
kind: Service
metadata:
  name: grafana
spec:
  ports:
    - port: 3000
      protocol: TCP
      targetPort: http-grafana
  selector:
    app: grafana
  sessionAffinity: None
  type: LoadBalancer
3. Once created apply the file in the Prometheus monitoring namespace using the below command.
kubectl apply -f grafana.yml -n <your-prometheus-namespace>
4. Once you have run the above command you should be able to see your Grafana pod inside Prometheus monitoring namespace like below image:

5. You can port forward to get your Grafana UI in the localhost:3000 using the below command:
kubectl port-forward service/grafana 3000:3000
6. However, port-forwarding will only expose the UI to you if you want to expose this Grafana to be used by others. We can use the external IP by checking the service and then add a DNS to it from your cloud console. To check the external IP type, the below command.
kubectl get svc -n <your-prometheus-monitoring namespace>

You can reach your Grafana ui using :3000.
*** External IP is not to be exposed and used, please ensure you add a dns name before sharing the Grafana details with others.
7. Use admin as username and password to login and then reset your password.
Once Grafana is set up, now is the time to connect a data source, and as mentioned above, we will be using Prometheus in our example next.
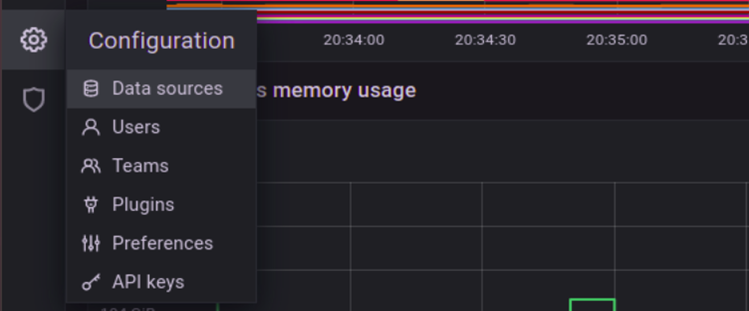
7.1 Click on the settings icon and select “Data Sources”. Check below image:
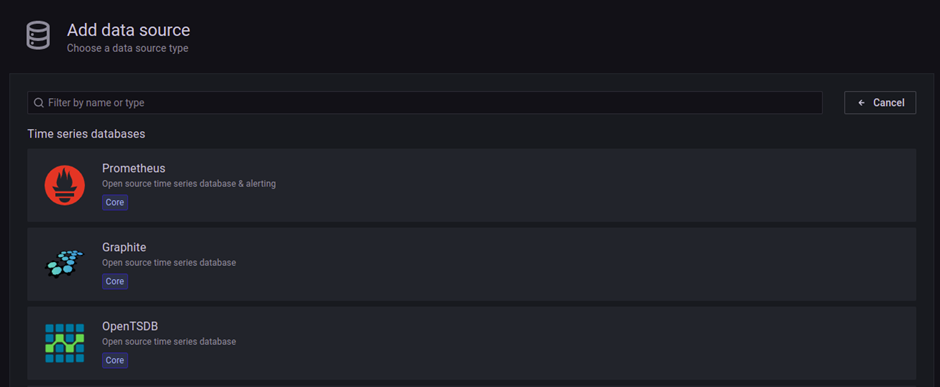
7.2 You will be taken to the Configuration page, where you have to click on “Add data source” tab.
7.3 Once you click on “Add data source” you will get a list of tools that can be used as your data source, select Prometheus from the list.
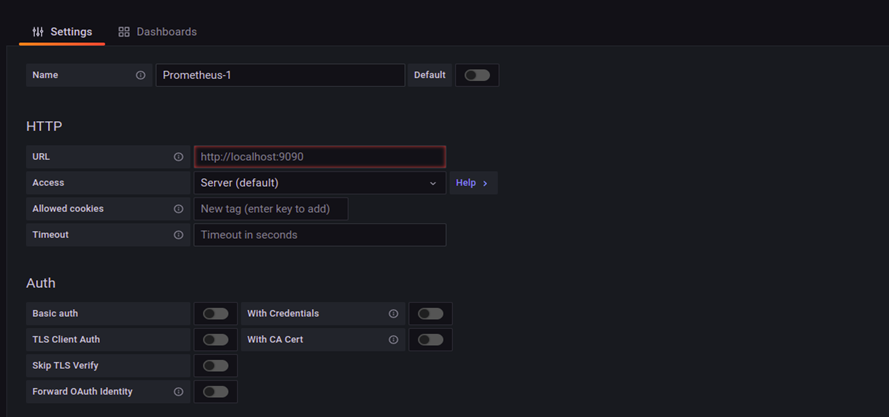
7.4 Once you select Prometheus, you will be taken to the setup page, where you can configure all your Prometheus settings. Usually, the Name field is chosen by default which you can edit as per your choice. You must enter the Prometheus URL in the URL section and configure Auth if you have applied the same in your Prometheus.
7.5 Once you have filled in all the necessary details, at the bottom of the page, you will get the “Save & test” button, which you have to hit to test your Prometheus connection. If all the setup is fine, you will get a confirmation stating “Data source updated” and “Data source is working,” like in the below images. If you get an error message, your Prometheus details must be checked.
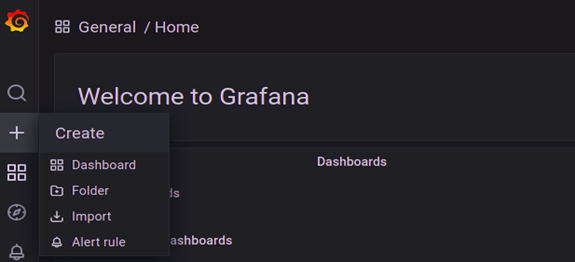
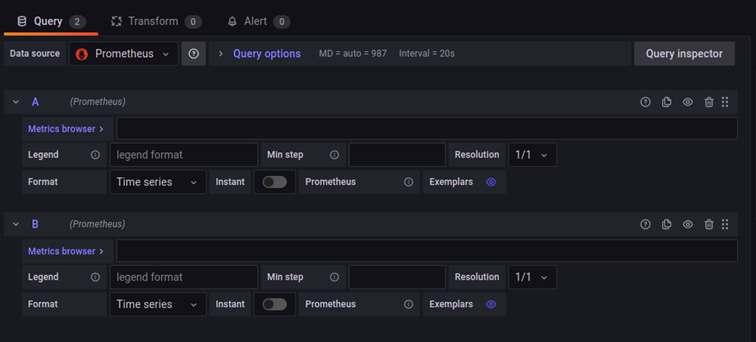
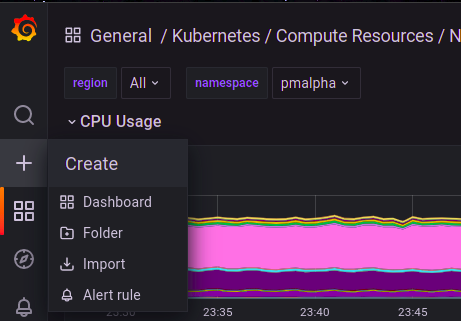
Now that we have set up the Prometheus data source, it is time to set up the Grafana dashboard. Even though you can create panels from scratch by clicking on the add button in the left panel of Grafana UI, you will have to enter or define each parameter and edit the metrics browser based on your data source.
These may not be comfortable for a lot of us at the beginning. To address this issue, Grafana provides custom dashboards, and these are some of the best dashboards available to be used: https://grafana.com/grafana/dashboards/
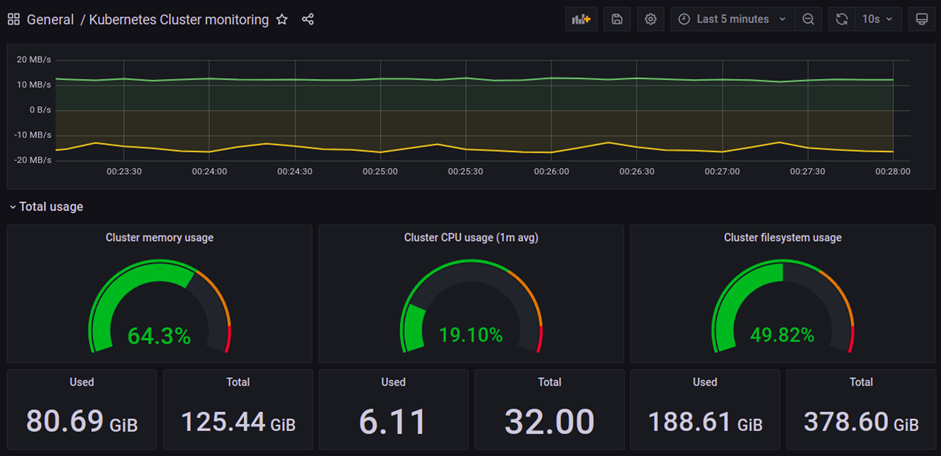
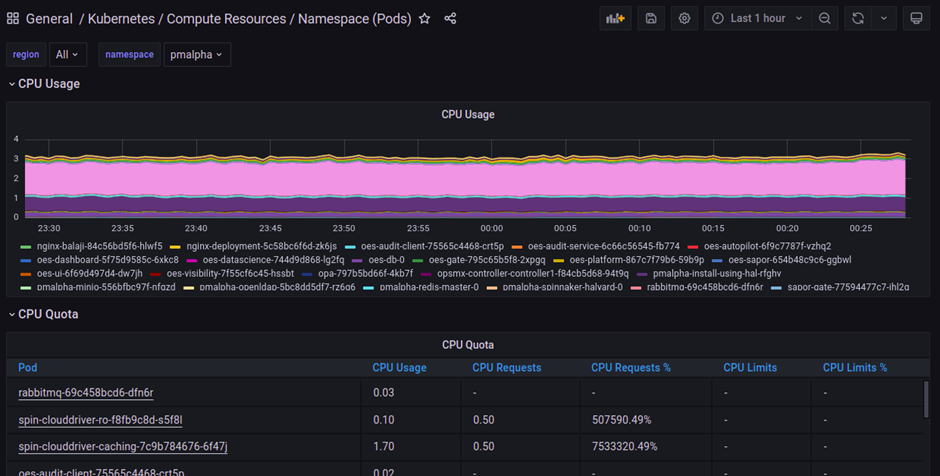
We can import the JSON of these ready-made dashboards and import the same in our Grafana UI. For Kubernetes cluster monitoring, very detailed dashboards are available through which we can monitor cluster namespace and pod level details in our Grafana.
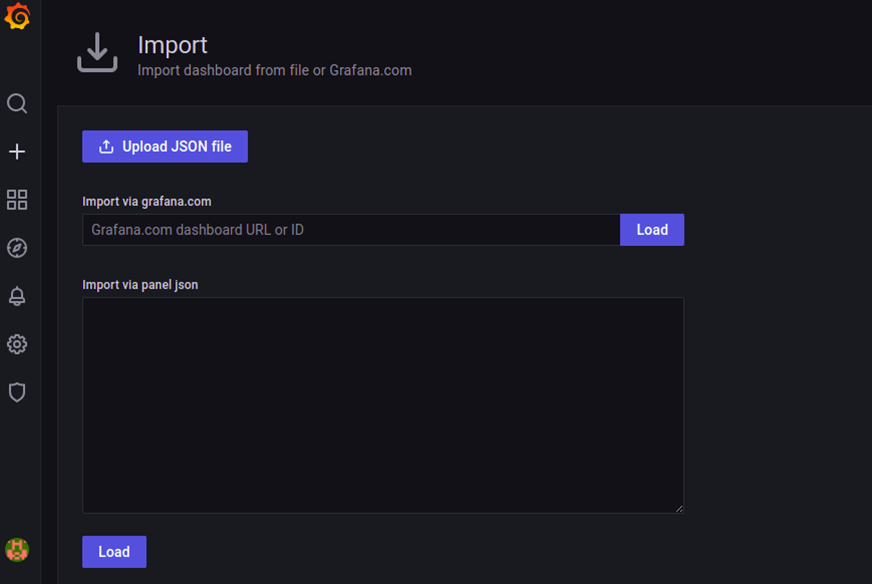
To import JSONs all we have to do is again click on the add button and click on “import”, then click on “Upload json file” to load your json file and voila your custom dashboard is ready for usage.
What makes Grafana Popular ?
Many companies are implementing Grafana as it can connect with many data sources, like Prometheus, MySQL, InfluxDB, AWS CloudWatch, and others. This flexibility of supporting various data sources and quick installation process has made Grafana quite popular among analysts, DevOps personnel, developers, and product managers.
Conclusion
We at OpsMx provide support for Grafana integration with our OpsMx Intelligent Software Delivery Platform. We also use Prometheus and Grafana to monitor some of our internal instances hosted on the cloud. We also effectively use Prometheus and Grafana to monitor Spinnaker instances actively.
If you are interested in OpsMx Intelligent Software Delivery Platform, give a try once





0 Comments