Background: Spinnaker-monitoring daemon collects metrics exposed and reported via a built-in endpoint in each spinnaker microservice instance. Refer to all the spinnaker microservices below.
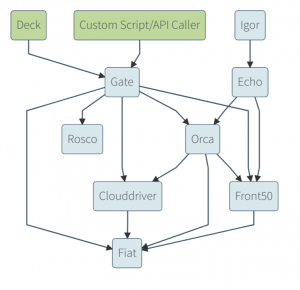
Spinnaker Architecture
Integration with a third-party event monitoring and alerting system like Prometheus allows it to record these real-time metrics in a time series database using polling (HTTP pull model). You can then use it to view dashboards, receive alerts, and informally browse depending on your needs. Learn more about how to set up monitoring spinnaker microservices.
Currently, enterprises need a more secure communication protocol ‘HTTPS’ instead of ‘HTTP’ to communicate between services, even within the same Kubernetes cluster. HTTPS ensures critical security and data integrity of communication between different applications, and no intruders can exploit your data from the exchange. (Know more why HTTPS?)
However, enabling metrics in spinnaker creates a sidecar container that calls the metrics endpoint of spinnaker service. This means the default container is unable to communicate in HTTPS.
In this blog, we will provide insights on how to enable ‘HTTPS’ so that the Spinnaker monitoring daemon can collect information from spinnaker services through the secured protocol.
Configuring ‘https’ may throw an errors like below:
(Version reference: SPINNAKER: 1.20.5, Halyard 1.38, Kubernetes v1.17.9-eks-4c6976)
Issue: Error in the monitoring daemon logs
0 Comments
Trackbacks/Pingbacks