
Today we are announcing the general availability of the OpsMx Enterprise for Spinnaker(OES) 3.1. OES 3.1 comes with new visualization and enhancements to our continuous verification platform. OES provides SREs and Ops teams the ability of cross-tier correlation of metrics/logs for faster diagnosis of anomalies in production. Another feature that will be useful for release managers is the visibility into trends and patterns of risks of distributed applications. With the new additions, OpsMx Enterprise for Spinnaker streamlines the canary deployments by providing an automated baseline. Let’s take a detailed look at all the features OpsMx has to unveil.
- TIME CORRELATION
- TREND ANALYSIS OF RISKS
- AUTOMATED BASELINE
TIME CORRELATION
More and more of our customers use cloud-native applications ( microservices) profusely for providing online services. Hence, service downtime plays a crucial role in maintaining quality service. Incident diagnosis is still conducted by manually analyzing many telemetry data collected from microservices in the runtime. Often support and maintenance engineers use techniques such as correlation analysis for data-driven incident diagnosis. However, it is challenging to analyze hundreds of metrics emitted from many microservices to avoid disruption or quickly restore service.
After our conversation with beta users, we realized that various monitoring tools and log analyzers are used to monitor infrastructure and complex microservice applications. However, the more in-depth analysis of the investigation is done by multiple teams in silos.
OES 3.1 introduces a time-correlation feature that allows users to diagnose performance issues and identify probable root cause through cross-tier correlation for both logs and metrics (refer Fig 1A) . OES can aggregate logs/metrics from different sources (refer to the list of integrations) into one page. For instance, users can analyze performance metrics for a single or a group of distributed applications. SREs and Ops teams can now find how each service in a microservice performs and determine a particular time when other services are acting similarly.
Furthermore, users will get to see all the clusters in log analysis, with critical errors and errors at the same time. Users also get the provision to select services in an application or all the applications for easy navigation (refer Fig 1B).
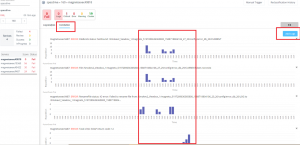
Cross-Tier Correlation in Enterprise Spinnaker
Fig 1A
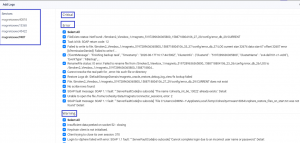
Fig 1B
Benefits:
- Comprehensive and real-time view of the performance of all infrastructure and distributed application
- Intelligent correlation of metrics and log with Machine learning
- Self-service environment for all SREs and Ops team
- Faster troubleshooting of problems in production
TREND ANALYSIS
Our continuous verification platform Autopilot takes metrics and log data from multiple sources and depicts a release’s performance and quality through risk assessment. Autopilot provides risk scores for each release in each stage of CD- Build, Test, deploy, and production stage. Now the next logical step is to understand the performance and quality trend of these releases.
OES 3.1 introduces Trend Analysis in Autopilot. A visualization feature that provides easy-to-use, intuitive UI for understanding trends of your application risks and takes precautionary actions. Managers want to visualize a consolidated interface of risk of application (or individual services in an application) across periods. Some release managers or project managers may be interested in understanding the log or metrics trend. E.g., how many critical errors, standard errors, or warnings have aroused in each deployment across the past four months, understand the trends and take corrective actions.
In Fig 2A, we have shown two graphs.
- Risk Score: The upper graph provides users with a risk score trend for application and its services. The visualization provides time-series data for any time period, from months to days to milliseconds.
- Log Graph: Depending on the service selected, the issue graph will show the issues – number of critical errors, errors and warnings for a time period. There is a provision to select a granular time period with a more detailed view.
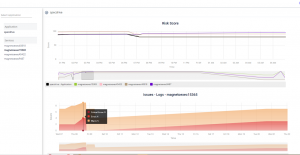
Trend Analysis of Risks in continuous delivery
Fig 2A
Benefits:
- Accelerated time to insights with an aggregated view of past trends on performance and quality of releases.
- Quickly identify trends and patterns and make better decisions for decreasing the risk of release.
AUTOMATED BASELINE:
Ops teams usually have to provide two files- metrics or log inputs for the current version ( aka baseline version) and metrics or logs for the new version ( aka canary version).
An automated canary analysis (ACA) performed by OES requires a baseline to be defined for the analysis. If a metric for the canary release under test is less than the baselines, then the canary can be considered suitable for production. Our continuous verification platform Autopilot score is from 100; zero means highly risky, and 100 means risk-free. However, in this process, an Ops person repeatedly executes analysis each time a canary is performed.
OES 3.1 brings the feature of an automated baseline in Autopilot that can calculate baselines automatically. To start with, users can configure ( like in Fig3A) such that OES takes the log reports for the current version and calculates baselines using AI/ML models. The canary analysis takes the logs from the canary version and automatically calculates the baseline for the next iteration. Now for the next canary analysis, OES will automatically confide a new baseline to the Ops team. In case the Ops team wants to provide feedback, machine learning algorithms will learn, improve, and accurately predict baseline for subsequent canary analysis.
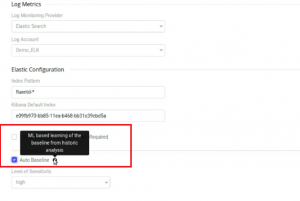
Automated Baseline for Canary Analysis in Spinnaker
Fig 3A
Benefits:
- Zero dependence on human expertise or contextual knowledge to calculate the baseline of each application.
- Leverage AI/ML and scale canary analysis to enterprise wide.
If you want to know more about the features in this release or request a demonstration, please book a meeting with us.
OpsMx is a leading provider of Continuous Delivery solutions that help enterprises safely deliver software at scale and without any human intervention. We help engineering teams take the risk and manual effort out of releasing innovations at the speed of modern business. For additional information, contact us.
0 Comments